Work Summary
The Work Summary dashboard turns your session history into analytics: how much you've run, how tokens were spent, and how agent activity compares over time.
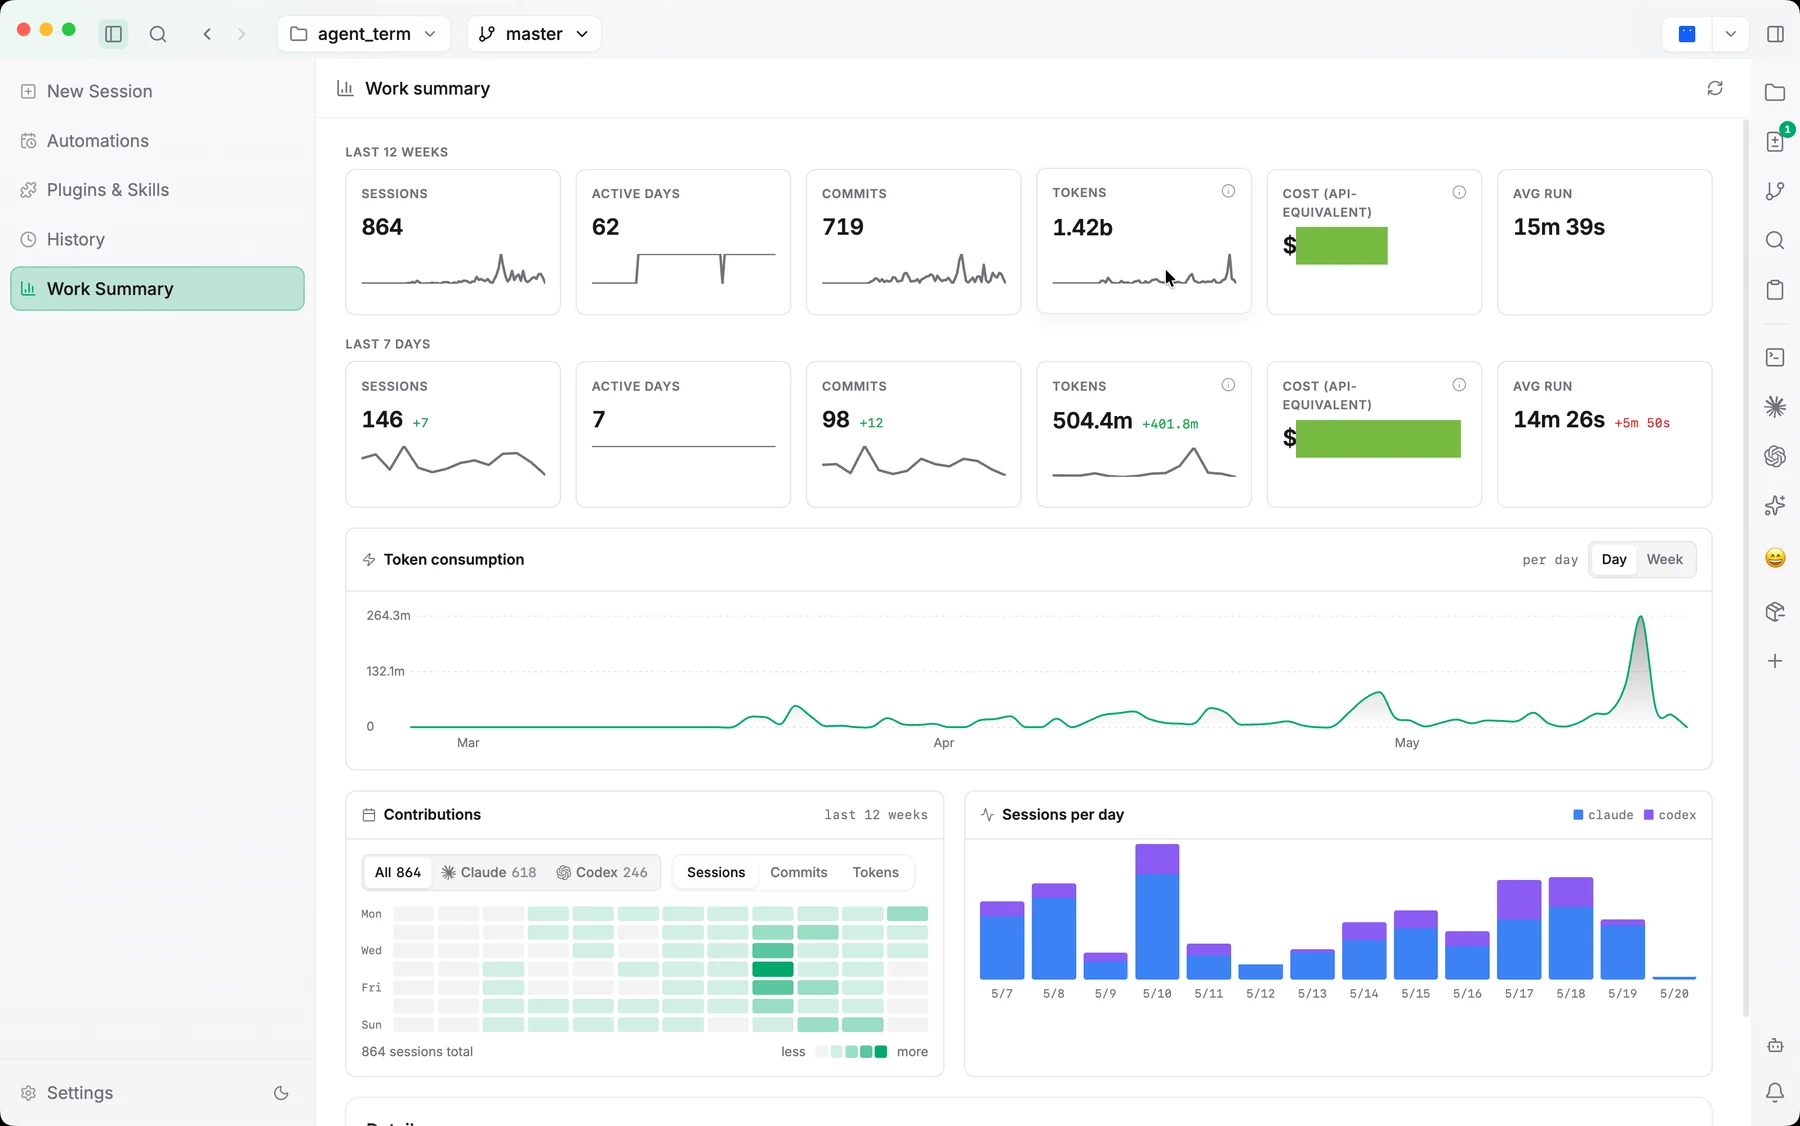
What it shows
- Activity calendar — a contribution-style heatmap of session activity by day, so you can see your cadence at a glance.
- Token usage — curves of token consumption over time.
- Session breakdown — aggregated metrics across sessions, including counts and durations.
- Agent comparison — how Claude and Codex activity stack up against each other.
- Contributions and commit activity — work that landed, tied back to your git history.
Why it's here
Delegating to agents makes it easy to lose track of how much work is happening and where the cost is going. The Work Summary keeps that visible — part of Jaade's broader aim of keeping agent work inspectable rather than out of sight.
Related
- Sessions & Chat — the history these analytics summarize.
- Token-rate estimates use Jaade's built-in pricing table for the models you run.